Mendive. Journal on Education, january-march 2022; 20(1): 270-284![]()
Translated from the original in Spanish
Original article
Statistics based on educational research. Challenge for education professionals
La Estadística en función de la investigación educativa. Reto para los profesionales de la educación
Estatísticas com base em pesquisa educacional. Desafio para profissionais de educação
Luis Enrique Cardoso Rojas1![]() http://orcid.org/0000-0002-7625-4336
http://orcid.org/0000-0002-7625-4336
Gresin Castro Pérez1![]() http://orcid.org/0000-0002-1633-1950
http://orcid.org/0000-0002-1633-1950
Carlos Luis Fernández Peña1![]() http://orcid.org/0000-0001-6833-0055
http://orcid.org/0000-0001-6833-0055
1University of Pinar del Río "Hermanos Saíz Montes de Oca". Cuba. ![]() luis.cardoso@upr.edu.cu, gresin77@gmail.com, carlosl.fernandez@upr.edu.cu
luis.cardoso@upr.edu.cu, gresin77@gmail.com, carlosl.fernandez@upr.edu.cu
Received: October 29th, 2021.
Accepted: January 26th, 2022.
ABSTRACT
The preparation of education professionals in the contents of Statistics based on educational research is a necessity for the successful development of research in this field. The objective of this article is to expose the limitations in the preparation of the contents of Statistics based on educational research as well as the results of the structuring and assessment of the impact of the improvement actions in this sense, for the teachers of the headquarters "Rafael María de Mendive", of the University of Pinar del Rio "Hnos Saíz Montes de Oca". The use of methods at a theoretical, empirical and statistical-mathematical level made it possible to verify the limitations of the initial state of said process, as well as the structuring and assessment of the impact of the product designed based on the preparation of the teachers , in such a way as to guarantee the acquisition of the contents of Statistics based on educational research and raise their level of development for conducting research, thus achieving greater objectivity of their results. The assessment of the improvement strategy in educational practice confirmed its theoretical, methodological and practical contribution, confirming higher levels in the preparation of teachers from the cognitive and instrumental point of view.
Keywords: Statistics; educational research; education professionals.
RESUMEN
La preparación de los profesionales de la educación en los contenidos de la Estadística, en función de la investigación educativa, constituye una necesidad para el desarrollo exitoso de las investigaciones en este campo. El presente artículo tiene como objetivo exponer las limitaciones en la preparación acerca de los contenidos de la Estadística en función de la investigación educativa, así como los resultados de la estructuración y valoración del impacto de las acciones de superación en este sentido, para los profesores de la sede "Rafael María de Mendive", de la Universidad de Pinar del Río "Hermanos Saíz Montes de Oca". El empleo de métodos de nivel teórico, empírico y estadístico-matemático permitió constatar las limitaciones del estado inicial de dicho proceso, así como la estructuración y valoración del impacto del producto diseñado, en función de la preparación de los profesores; todo, de manera que se garantice la adquisición de los contenidos de la Estadística vinculado a la investigación educativa, para que eleve su nivel de desarrollo para la realización de las investigaciones, logrando así una mayor objetividad de sus resultados. La valoración de la estrategia de superación en la práctica educativa constató su aporte teórico, metodológico y práctico, confirmando niveles superiores en la preparación de los profesores desde el punto de vista cognitivo e instrumental.
Palabras clave: Estadística; investigación educativa; profesionales de la educación.
RESUMO
A preparação dos profissionais da educação nos conteúdos de Estatística com base na pesquisa educacional é uma necessidade para o sucesso do desenvolvimento de pesquisas neste campo. O objetivo deste artigo é expor as limitações na elaboração dos conteúdos de Estatística com base em pesquisas educacionais, bem como os resultados da estruturação e avaliação do impacto das ações de melhoria nesse sentido, para os professores da sede "Rafael María de Mendive", da Universidade de Pinar del Río "Hermanos Saíz Montes de Oca". A utilização de métodos a nível teórico, empírico e estatístico-matemático permitiu verificar as limitações do estado inicial do referido processo, bem como a estruturação e avaliação do impacto do produto concebido com base na preparação dos docentes , de forma a garantir a aquisição dos conteúdos de Estatística com base na investigação educacional e elevar o seu nível de desenvolvimento para a realização de investigação, conseguindo assim uma maior objectividade dos seus resultados. A avaliação da estratégia de melhoria na prática educativa confirmou sua contribuição teórica, metodológica e prática, confirmando níveis mais elevados na formação de professores do ponto de vista cognitivo e instrumental.
Palavras-chave: Estatística; pesquisa educacional; profissionais da educação.
INTRODUCTION
The current world imposes great challenges with the aspiration of forming an integral human being, in such a way that it guarantees putting in the hands of society the most innovative science and technology, in which the scientific training of professionals of Education plays a fundamental role.
In this sense, continuous training is promoted, also called permanent, which is developed from postgraduate education, in which one or more training processes concur, not only teaching-learning, but also research, innovation and structure in professional improvement and academic training, in which the organizational forms are constituted: The Postgraduate specialty, the Master's degree and the Doctorate. This aims to promote the improvement and quality of the process, with the introduction of results for decision making in the strategic line of the postgraduate improvement system with the impact of scientific results.
Research carried out in the field of education generates a large amount of data, so the use of statistical-mathematical methods plays an important role in its processing and subsequent analysis and interpretation; hence the need for teachers to improve on the contents of Statistics, allowing them to appropriate the methods and techniques of descriptive and inferential analysis for the study and solution of problems in educational reality. This leads to the adequate planning of the collection of information from the operationalization of the variable of the object of study, the design of the measurement instruments, the organization, summary and representation of the data of the intervening variables, as well as the assessment of the effectiveness of the proposal in educational practice, so as to guarantee the level of objectivity required by each science.
The overcoming in Statistics based on the educational research of the education professional is a problem of great relevance and national and international relevance, approached by many researchers from different angles. Among them are: Añorga, Valcárcel and Che (2008), Torres (2012), Medina (2015), Carballo and Guelmes (2016), Gamboa (2018), Pérez, Crespo and López (2018) and others that, although they address content Isolated about this science, they do delve into the need for its usefulness to enhance research from the interpretation and solution of professional problems to reach valid conclusions and make reasonable decisions.
However, in an exploratory study carried out at the "Rafael María de Mendive" headquarters of the "Hermanos Saíz Montes de Oca" University of Pinar del Río in 2015, based on the review of master's and doctoral theses, the interview with professors and the observation of master's and doctoral defense exercises, a group of insufficiencies related to the use of Statistics in terms of educational research were verified, such as:
This article aims to expose the limitations in the preparation of the contents of Statistics based on educational research, as well as the results of the structuring and assessment of the impact of improvement actions, in this sense, for teachers of the "Rafael María de Mendive" headquarters of the "Hermanos Saíz Montes de Oca" University of Pinar del Río.
MATERIALS AND METHODS
The present investigation assumed the general dialectical-materialist method, which allowed the study of the object as a process, from its genesis, with its internal and external contradictions, as well as the selection of methods of the theoretical, empirical and statistical-mathematical levels.
In accordance with the objective, a sample was selected through the use of simple random sampling, made up of 32 professors from the "Rafael María de Mendive" campus of the "Hermanos Saíz Montes de Oca" University of Pinar del Río, who studied the Master's Degree in Education in the period 2015-2017.
Among the theoretical level methods used are: the historical-logical analysis, which made possible the study of the trajectory of the object of investigation and the approach to the theoretical references, establishing the internal logic of development, as well as the taking of positions at the respect, and the structural-functional systemic, which facilitated the general orientation in the elaboration of the overcoming actions and the determination of the relations between them.
Regarding the empirical level methods, the following were used: the content analysis in its empirical variant, for the treatment and interpretation of documents such as the master's theses of the university professors and the records of improvement that appear in the department of self-improvement and postgraduate studies to analyze how self-improvement behaves in matters of Statistics; the interview with Master's and Doctor's graduate professors, to verify the preparation they receive in the contents of Statistics based on educational research. Also, 100 theses of the Master's in Education, carried out and tutored by professors of the aforementioned pedagogical headquarters, were reviewed and a pedagogical test was carried out on the 32 professors who made up the sample.
For the current state of the process under study, the variable was operationalized, divided into two dimensions and their respective indicators:
Cognitive-instrumental dimension: integration of theoretical and practical knowledge, necessary to carry out the procedures to be used for the statistical design of the investigation, the processing and the analysis and interpretation of the data, which allow reaching objective conclusions about the educational phenomenon object of study.
Indicators:
Attitudinal dimension: includes the dispositions and motivations of teachers for the contents of Statistics, which is manifested in the need for constant inquiry, the assessment of their results and the level of application of their knowledge.
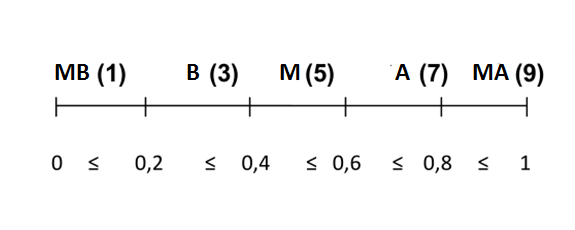
For the processing of the obtained data, the calculation of the index was mainly used as a technique of descriptive statistics and five categories were assumed to evaluate the indicators, the dimensions and the variable in general. The indicators are evaluated as very low when the index (I) is between 0<Id"0.2; low, when the index is between 0.2 <Id"0.4; medium, when the index is between 0.4<Id" 0.6; high, when the index is between 0.6<Id"0.8; and very high, when the index is greater than 0.8<I, from the results of the parameterization of the variable. The dimensions and the variable are evaluated from the calculation of the index as a result of the evaluation of the indicators, where numerical values are assigned to each of the categories to calculate the index.
Next, you can see the decision rules and the formulas for calculating the index of the dimensions and the variable (table 1):
Table 1- Decision rules
rating scale |
Abbreviation |
Quantitative scale |
Very high |
MA |
9 |
High |
A |
7 |
Medium |
M |
5 |
Low |
B. |
3 |
very low |
MB |
1 |
Where:
Calculation of the index of dimension I:
![]()
The value of I is the evaluation of the indicator where it is taken to the quantitative scale and in the denominator, 7 is the number of indicators and 9 the maximum value that it takes on the quantitative scale.
Calculation of the index of dimension II:
![]()
Calculation of the variable index:
![]()
For the analysis of the feasibility in the educational practice of the proposed solution, the sign test was used, based on the results of the evaluation of the indicators in the pre -experiment, with a sample of 32 teachers who studied the Master of Science of Education.
RESULTS
For the evaluation of the indicators of the variable, the results of the thesis revision and the pedagogical test were integrated. Each of the indicators was evaluated by dimensions, considering the categories used and the calculation of the index.
Of a total of 100 theses reviewed, in 40% the indicators of the variables were not correctly determined; in 85% the measurement scales for the variable were not established; while in 90%, the measurement instruments were not related to the indicators to be measured, without validity.
On the other hand, in 95% of the theses the sampling schemes for the selection of the sample were not used correctly, observing a predominance of intentional sampling, which evidenced the non-selection of the representative sample of the population and made it impossible to making inferences due to the lack of randomness of the data obtained.
It should be noted that in 60% of the theses, frequency distribution tables were not prepared for the organization of the data, with a tendency towards percentage analysis for the summary of the data, expressed in 87%. Statistical tables and graphs were used in 100% of the theses examined; however, they were not in correspondence with the type of variable analyzed and did not allow the analysis and interpretation of the data they represent. It is also striking how, in 95% of the cases, the statistical assessment tests were not applied and selected appropriately; while in 75% no logical conclusions were reached, nor were arguments found to respond to hypotheses, ideas to defend or scientific questions.
From these results, the index was calculated for each of the indicators and was integrated with the results of the pedagogical test; The result was that the cognitive-instrumental dimension was evaluated with a low level, since many indicators were evaluated as very low, including those related to the level of sample selection, for an index of 0.15. The summary level of the data, with an index of 0.18; the level of projection and application of statistical assessment tests, with an index of 0.13.
The indicators related to the level at which the indicators of the variable are determined were evaluated as low, with an index of 0.22; the level at which the information collection instruments are constructed, with an index of 0.33; as well as the level of data representation, with an index of 0.39. In the case of the indicator associated with the level of communication of the results obtained, it was estimated as medium, with an index of 0.45.
Based on the results of the diagnosis, a group of improvement actions were developed aimed at preparing teachers in the contents of Statistics, based on educational research. The actions have a sequenced and interrelated nature, in order to consciously and intentionally direct the process under study.
Diagnostic Actions
Actions of theoretical-practical generalizations
Knowledge Application Actions
Evaluation Actions
After implementing the actions for several courses, an assessment of their effectiveness was carried out, evaluating the indicators of the cognitive-instrumental dimension fundamentally in the review of the theses and the pedagogical test of the selected sample. The sign test is applied from the results of the applied instruments and a qualitative assessment of the results is made.
Statistical sign test results:
1. Statement of the problem: the interest is to know if the improvement actions cause significant changes in the preparation of teachers in the contents of Statistics, based on educational research.
2. Approaches of the starting hypotheses:
3. Selection of the statistical evaluation test: since the problem poses us to determine the significance in the change of an indicator of the phenomenon or process, having exerted on the group a system of controlled external actions, recorded on an ordinal scale with many ligatures, the valuation test to be applied is that of signs.
4. Set the significance level: a significance level of á=0.01 is assumed.
5. Definition of the region of rejection:
the statistical test of evaluation of the signs
is compared with the values of the normal distribution of probabilities, that for a level
of significance of 0.01, if ![]() Ho is rejected; otherwise it is accepted.
Ho is rejected; otherwise it is accepted.
6. Calculation of the test statistician: the calculation of Zp (test statistician), from the data record to compare with the critical value in the normal probability distribution table, is performed according to the formula:
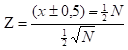
Where:
X: Number of positive changes
N: sample size
![]() : It's used when
: It's used when![]()
![]() It's used when
It's used when ![]()
The results obtained before and after applying the actions in relation to the subjects (teachers) are shown below:
Table 2- Comparison of the results in the groups before and after applying the actions.
subjects |
1 |
2 |
3 |
4 |
5 |
6 |
7 |
8 |
9 |
10 |
11 |
12 |
13 |
14 |
15 |
16 |
Before |
B. |
MB |
M |
B. |
M |
MB |
B. |
M |
M |
MB |
B. |
M |
MB |
B. |
B. |
M |
After |
A |
A |
A |
M |
A |
A |
A |
M |
A |
M |
A |
A |
M |
A |
B. |
M |
signs |
+ |
+ |
+ |
+ |
+ |
+ |
+ |
0 |
+ |
+ |
+ |
+ |
+ |
+ |
0 |
0 |
subjects |
17 |
18 |
19 |
20 |
21 |
22 |
23 |
24 |
25 |
26 |
27 |
28 |
29 |
30 |
31 |
32 |
Before |
M |
M |
M |
MB |
B. |
B. |
B. |
B. |
B. |
MB |
B. |
M |
MB |
B. |
B. |
M |
After |
M |
M |
MA |
M |
B. |
A |
A |
M |
M |
MB |
M |
A |
A |
A |
A |
M |
signs |
0 |
0 |
+ |
+ |
0 |
+ |
+ |
+ |
+ |
0 |
+ |
+ |
+ |
+ |
+ |
0 |
From the results observed in Table 2, the following data are extracted.
Data: x=24, N= 32 so substituting in the formula we have:
![]()
7. Decision making by the researcher: since the calculated test statistician ( Zp ) is greater than the critical value in the normal distribution table, for the chosen level of significance, it can be stated that it is very likely that the actions of overcoming contribute to the preparation of the teachers of the "Rafael María de Mendive" campus, in the contents of Statistics, based on educational research.
Regarding the results from the qualitative point of view, it is necessary to point out the progress experienced by the teachers in the process of parameterization of the variable, in the preparation of tables and graphs and in the application of the calculation of indices for the evaluation of the indicators. , dimensions and variables, as well as their level of satisfaction with the different ways of overcoming and the knowledge acquired in working with the SPSS Software and the Excel application.
DISCUSSION
The results obtained after the application of the aforementioned system of methods, the description of the improvement actions, as well as the theoretical systematization on the subject, show the need to delve into this article, due to the importance of the preparation of teachers of the pedagogical careers in the contents of Statistics, based on educational research, for the application of the scientific method in the solution to the problems of the educational reality.
However, as shown by the results of the indicators of the cognitive-instrumental dimension analyzed in this research, mainly: the level of sample selection, the level of data summary, the level of projection and application of statistical tests of evaluation, are evaluated very low and the indicators: the level at which the indicators of the variable are determined, the level at which the information collection instruments are built, as well as the level of representation of the data, are evaluated low. This shows that it is necessary to develop actions aimed at improving teachers in relation to the contents of Statistics, based on educational research, mainly with the use of ICT.
In the study carried out in relation to the operationalization of the variables, it was found that difficulties persist in establishing its domain, the values that it can take in relation to the object of study, which guarantees that the data collected are truly those that are needed to have a real image of the process being studied, which turns out to be very complex and contradictory, due to the various factors that influence it and that must be taken into account for diagnosing its current state.
In this sense, it coincides with Medina (2015) when stating that the operationalization of the dependent variable supports the parameterization and allows: modeling, based on the theory and depending on the nature of the object of study, the basic components of the theoretical design -methodological and its relationships; carry out the effective evaluation of the same; continue the problematization process that should have started from the first moments of the investigation and that at this time should be oriented towards the modeling of the variable(s), based on the basic components of the theoretical-methodological design and independently of the investigative approach intended to be used in the research.
In addition, the operationalization allows to determine the indicators that are simple variables and, through these, the dependent variable that belongs to the object of investigation can be measured. The indicators, therefore, are the directly perceptible features of the object and must be expressed in terms that guarantee their measurement, in this way the words must be used at the beginning of these: quantity, frequency, number, grade, level, and state, among others, so that the scales in which they are going to be measured are derived from these.
On this aspect, it is worth noting that a process of synthesis of the information obtained from the actions of the empirical inquiry on the dependent variable is necessary to arrive at more general conclusions related to it (Valledor & Guerrero, 2018). Therefore, the conclusions of each of the indicators must be integrated into generalizing conclusions that characterize the dimensions, and the conclusions by dimensions must also be integrated in correspondence with the essential features of the variable, highlighting the relationships established between variable, dimensions, indicators and measuring instruments, therefore, using a greater number of indicators allows a better understanding of the object under investigation.
It has also been observed that there is no detailed analysis of the methods that will be used to collect the information of the previously determined indicators, in which each indicator is matched with the indicated instrument; In addition, the items per indicator are previously determined, which brings with it the collection of information that is not used in the research and other times the information that is truly needed to characterize the object of study is not collected. It should be noted that the measurement instruments play a preponderant role in the investigation and take into account that the application of each one of them separately does not allow us to penetrate the essence of the phenomenon under study, more, when we are studying individuals who manifest individual differences (Gamboa, 2018). In the social sciences, surveys, interview guides, psycho diagnostic instruments , observation guides in the field of development of the phenomenon or process are common, and to prepare them it is necessary to keep in mind that they meet the validity and reliability requirements as proposed by López et al. (2019); that is, validity, which is the degree to which an instrument measures what it should measure, and reliability, which is the degree of consistency with which an instrument measures the variable. Based on these criteria, the necessary use of various instruments and their rigorous preparation is evident, having as a starting point each of the indicators of the variable under study.
In accordance with the above, prior to the construction of the instruments, a parameterization process of the variable must be carried out, which consists of deriving the analysis of the object of study and field of action with measurable or observable elements that allow the assessment or issuing value judgments about the state, level or development of the phenomenon or process under investigation. This process not only covers the operationalization of the variable until reaching the indicators, but also allows an analysis of the instruments to be used and the items in relation to each indicator, which, therefore, enables the rational construction of the measurement instruments that will be used in the research (Carballo & Guelmes, 2016). In addition, parameterization can serve, both to carry out the construction of empirical and theoretical inquiries, from breaking down the object and/or field of action, generally very broad, and to make methodological value judgments about the phenomenon or object investigated (Añorga, Valcárcel & Che, 2008), and takes us into the object of study based on its diagnosis and characterization, to demonstrate that the problem is objective and needs to be solved.
On the other hand, excessive abuse of the so-called "percentage analysis" method has been observed and even used to make inferences. It is known that most of the data generated in educational research is measured on ordinal scales, where it is very difficult to use summary measures such as the mode, the median and the arithmetic mean or others; for these cases there are other ways of performing quantitative analysis. In this case, the percentage should not be abused, since it is a descriptive measure that only expresses the external behavior of the variable under study and not the internal structure of the analyzed system. It should be noted that one of the characteristics of educational research is that it studies social phenomena that constitute open, contradictory systems, made up of many open and multi determined components and the predominance of ordinal scales, which complicates its measurement with the use of summary measures (arithmetic mean, median, variance), although in some cases there are real possibilities for their use. In addition, it is suggested that the interpretation of the different statistical measures must obey a joint and crossed analysis of the results obtained; An isolated study of summary statistics would not provide the clarity required for decision making.
Then, to evaluate the variable in a general way, the use of indices is recommended following a compensatory model, in which the low scores in some dimensions or indicators are compensated by high scores in others, as shown in the materials and methods of assessment section. this article, where five categories (very high (9), high (7), medium (5), low (3) and very low (1)) are used to evaluate the indicators, the dimensions and the variable and it is assigned a numerical value to each category; once the domain of the variable is established from determining when each indicator reaches a category, an equation with stable values is used to calculate an index and it is compared with a general scale. Obviously, all this quantitative analysis allows a better qualitative interpretation of the phenomenon being studied and allows the integration of each of the indicators in generalizing conclusions for the characterization of the dimensions and the variable, as proposed by Valledor & Guerrero (2018).
Regarding the selection of the sample, there is a predominance of intentional sampling, even when it is necessary to apply other types of probabilistic schemes, so it must be taken into account that all these analyzes about the behavior of the object of study are made on the selected sample; When the population is very large, it is very complex to work with a large number of subjects and, as is to be expected, in order to guarantee its representativeness, it is necessary to use a random sampling scheme, otherwise inferences cannot be made as shown. refers in Gamboa (2018). In addition, the information obtained with the application of the instruments is not objective.
Another aspect that should not be overlooked is the presentation of the information, which shows insufficiencies in terms of the way in which the tables and graphs are made where, many times in the tables the variables analyzed are not adequately related, so that the interpretations of the internal behavior of the data can be made and in the statistical graphs the titles of each one of the axes are not clearly represented nor the values assumed by the indicators and a good comparison of these is impossible; In addition, they are made without taking into account the type of data. In this case, it should be noted that the presentation of the data in a way that transmits its essential features, according to Villegas (2019), requires the researcher to master the necessary procedures to build the different types of tables, graphs and images, since they constitute elements of help to display information quickly and concisely; Therefore, a detailed analysis of the type of data that is to be represented is required for the selection and adequate design of the graph, so that it transmits the information that is to be represented and that allows its easy interpretation.
Finally, it has been verified that in most of the reviewed investigations there is an excessive use of the method of expert criteria for the confirmation of the effectiveness of the proposed solution of the scientific problem, without the introduction of this in the educational practice and even no evidence is shown of the names of the thirty experts, who at least must be consulted for the study. It is obvious that in order to reach conclusions from the processed data and determine the degree of uncertainty, the researcher must know how complex personality turns out to be, and although numerical values are used, the causal factors implicit in the uncertainty must be considered the decision-making time. Regardless of the fact that there are various ways to check the feasibility of the proposed solution to the problem, it is necessary, taking as an irreplaceable reference to the theory of knowledge of dialectical and historical materialism, its assessment in practice, which contributes to the strengthening of objectivity in the proceeding and in the investigative results; above all, it gives the possibility of making a real and effective contribution to the demanded permanent improvement of the quality of the educational service in the country (Torres, 2012). In this sense, there are different variants of experimental designs that can be applied in these investigations.
In addition, the verification in practice of the effectiveness of the proposed solution to the problem can not only be carried out through the analysis of a set of summarized and graphically represented data, statistical tests must also be used according to the type of measurement scale, to the sample characteristics and the type of inquiry carried out in educational research; a group of empirical inquiries are adapted that require non-parametric hypothesis tests, which depend on the measurement scale used and the size of the sample and must be conducted through certain logical steps, with the support of the processing and analysis of the data obtained (Rodríguez & Pérez, 2017).
However, to be consistent with the materialist dialectic, educational practice should not be dispensed with as an evaluative criterion, and the sophisticated non-parametric hypothesis tests that exist (Pérez, 2006) to verify the effectiveness of the research results; although according to Torres (2012) that a few numbers, generally, the calculated value of the statistic and the level of significance associated with it are presented as irrefutable proof of validity, it must be added that to carry out this test it is first necessary to submit to the research variable to a complex process of obtaining data, that these are what allow us to reach the final statistician.
The elements raised about Statistics recover more value if what it is proposed by Torres (2021) is analyzed, when referring to the fact that the objectivity of the research results depends on the validity of the assumed theoretical-referential framework, of the theoretical and operational definitions of the main variables of the research, of the research instruments built on the basis of said definitions, of the selected statistical sample, of the field work carried out, of the statistical analysis, of the logic of the captured data, as well as the need to validation in practice of scientific results (Torres, 2021).
So, all this complex data processing can be mitigated with the inclusion of computers in statistical processing; both the Excel application and the specialized professional software or statistical packages, which do the calculations, graphs, tables and even test analysis, in fractions of a second, not only manage to optimize the processing of information, they also make it more affordable improvement in Statistics and motivation for this discipline (Pérez, 2006; Rivadeneira et al. 2020). In addition, it is essential, due to the role it plays in the investigations that said professional has to carry out. Therefore, this also implies mastery of some specialized computer systems, which helps to develop skills for working with new technologies and makes it easier for you to manage specialized systems with greater efficiency and effectiveness and correctly interpret the results obtained from its use to the solution of investigative problems; finally, select among the statistical techniques provided by the software, those that best suit the conditions of the problem to be solved.
The use of Information and Communication Technologies (ICT) constitutes an element of great value for education professionals to improve in the contents of Statistics, mainly in the distance modality, due to the fact that the new scenarios of knowledge society bring with them radical changes in all social structures and institutions, where education, and specifically higher education and postgraduate education, are being severely questioned in all its aspects. In this sense, multiple opportunities have been opened for teacher training with non-face-to-face alternatives incorporated into the plans for their improvement, aimed at expanding and diversifying study opportunities and favoring the development of conceptual, procedural and axiological resources that enhance their self- improvement as a pillar of permanent training (Pupo & Plaza, 2021).
In addition, data management today requires the use of powerful tools to facilitate the use of data, speed up the obtaining of results and to obtain better precision of the same. SPSS is a statistical package that allows to generate and transform databases, perform statistical analysis of data as well as their forms of representation and has the advantages of saving time and effort, making it possible to perform more accurate calculations, giving possibility of working with large amounts of data, using larger samples and including more variables, facilitating the analysis and interpretation of data for decision making (Rivadeneira et al. , 2020).
Related to the above, Pérez et al. (2018) determined the key variables for the teaching of Statistics in which they are found: final evaluation of the integrative problem with the use of software and the use of the internet in terms of teaching, which indicate where to focus teaching, how evaluate, and that it is necessary to delve into the multiple resources that exist on the Internet to support the teaching of Statistics; This is where the importance given to ICT for learning Statistics is evident and that it can also be considered of value for any type of improvement in this science.
The results obtained show that in the conception of overcoming the contents of Statistics, based on the educational research of education professionals, there are insufficiencies that affect the successful development of the investigative function, which raises the need to make a proposal that agrees to develop concrete actions to contribute to it, based on the use of organizational forms of improvement, with emphasis on distance postgraduate courses, workshops, consulting and self- improvement, in accordance with the characteristics of the most essential contents.
BIBLIOGRAPHIC REFERENCES
Añorga, J., Valcárcel, N. & Che, J. (2008). La parametrización en la investigación educativa. Varona. Revista Científico Metodológica, 47, 25-32. https://www.redalyc.org/articulo.oa?id=360635567005
Carballo, M. & Guelmes, E. L. (2016). Algunas consideraciones acerca de las variables en las investigaciones que se desarrollan en educación. Universidad y Sociedad, 8(1). https://rus.ucf.edu.cu/index.php/rus/article/view/317
Gamboa, M. E. (2018). Estadística aplicada a la investigación educativa. Dilemas contemporáneos: Educación, Política y Valores, 2. https://www.dilemascontemporaneoseducacionpoliticayvalores.com/index.php/dilemas/article/view/427
López, R., Avello, R., Palmero, D. E., Sánchez, S. & Quintana, M. (2019). Validación de instrumentos como garantía de la credibilidad en las investigaciones científicas. Revista Cubana de Medicina Militar, 48(2(Sup)), 441-450. http://revmedmilitar.sld.cu/index.php/mil/article/view/390
Medina, N. F. (2015). Las variables complejas en investigaciones pedagógicas. Revista de Investigación Apuntes Universitarios, 2(2). https://revistas.upeu.edu.pe/index.php/ra_universitarios/article/view/53
Pérez, L. O. (2006). Microsoft Excel: Una herramienta para la investigación. Medisur, 4(3), 68-71. http://www.medisur.sld.cu/index.php/medisur/article/view/225
Pérez, Y. T., Crespo, T. P. & López, R. (2018). Análisis estructural prospectivo sobre la enseñanza de la estadística en las carreras universitarias. Conrado, 14, 340-349. http://scielo.sld.cu/scielo.php?script=sci_abstract&pid=S1990-86442018000500340&lng=es&nrm=iso&tlng=es
Pupo, A. R. & Plaza, B. R. (2021). La superación profesional a distancia en la educación superior. Revista Conrado, 17(S1), 139-145. https://conrado.ucf.edu.cu/index.php/conrado/article/view /1759
Rivadeneira, J. L., Barrera, M. V. & De La Hoz, A. I. (2020). Análisis general del spss y su utilidad en la estadística. E-IDEA Journal of Business Sciences, 2(4), 17-25. https://revista.estudioidea.org/ojs/index.php/eidea/article/view/19
Rodríguez, A. & Pérez, A. O. (2017). Métodos científicos de indagación y de construcción del conocimiento. Revista Escuela de Administración de Negocios, 82, 175-195. https://doi.org/10.21158/01208160.n82.2017.1647; https://journal.universidadean.edu.co/index.php/Revista/article/view/1647
Torres, P.A. (2012). ¿No a los experimentos pedagógicos? ¿entonces, qué? Mendive. Revista de Educación, 11(1), 61-70. https://mendive.upr.edu.cu/index.php/MendiveUPR/article/view/572
Torres, P. A. (2021). Las Ciencias de la Educación en Cuba. `Hablan' las evidencias: ¿qué hay que mejorar? (Ensayo científico). Taller científico del CEE y Conferencia Internacional de la Red RILPE "Retos y perspectivas de las Ciencias de la Educación". Ciego de Ávila, Cuba. https://drive.google.com/file/d/1whBYl2ayalLrCYyQSm1mNf3U-RRdvaLj/view
Valledor Estevill, R. & Guerrero García, J. (2018). El estudio y la transposición de contenidos en la investigación educacional. Opuntia Brava, 9(4), 165-177. http://opuntiabrava.ult.edu.cu/index.php/opuntiabrava/article/view/219
Villegas, D. A. (2019). La importancia de la estadística aplicada para la toma de decisiones en Marketing. Revista Investigación y Negocios, 12(20), 31-44. http://www.scielo.org.bo/scielo.php?pid=S2521-27372019000200004&script=sci_abstract
Conflict of interests
The authors declare not to have any interest conflicts.
Authors contribution
The authors have participated in the writing, revision, updating of the bibliographic sources of the article.
![]()
This work is under a licencia de Creative Commons Reconocimiento-NoComercial 4.0 Internacional
Copyright (c) Luis Enrique Cardoso Rojas, Gresin Castro Pérez, Carlos Luis Fernández Peña